
Introduction
Why Visual Thinking?
Because human beings have a well-developed visual sense which far outweighs our other senses.
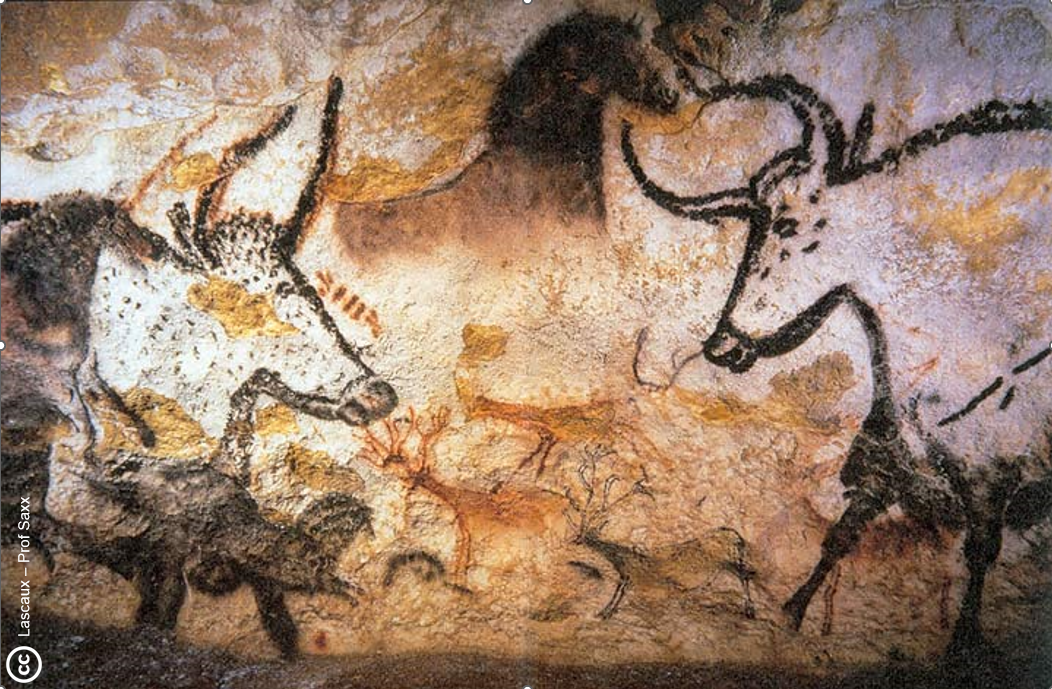
Since earliest times we have represented our deepest thoughts and feelings in a visual form. Millenia ago our ancestors created representations of their lives and beliefs in pictures on cave walls.
In more recent times literacy and numeracy have allowed us to develop advanced civilizations and execute massive projects.
So! Have we just outgrown our earlier visual representations?

Above is an example of our granddaughter’s artwork on my whiteboard.
Do we just grow or evolve out of our childish habits and become grown-up responsible adults?
I have given several talks on improving PowerPoint presentations, by reducing the volume of text, and replacing it with graphics and pictures.
Often the response is that looks good, and it is all very well for personal presentations, but we could not do that in a business setting.
Of course, you can!
Let me suggest why you should.
The Visual Mammal
From our earliest history as a species and the early stages of development as a person, we can see there is a strong urge to use our visual ability to communicate.
But in our structured and often rigid social and education system, we suppress this impulse and channel our children away from developing a natural talent.
We impose upon them the proper grown-up way to do things.
No more cave paintings, you are a big person now!

As can be seen from the infographic above 90% of the information we process comes from our vision, with all our remaining senses accounting for the remaining 10%.
In addition, we can process images as much as 60,000 times faster than we can read text.1
Given these numbers it is obvious that we should play to our strengths and those of our audience and convey our message visually whenever and wherever possible.
Let’s look at some examples.
Examples
Charles-Joseph Minard and Napoleon’s 1812 Russia Campaign
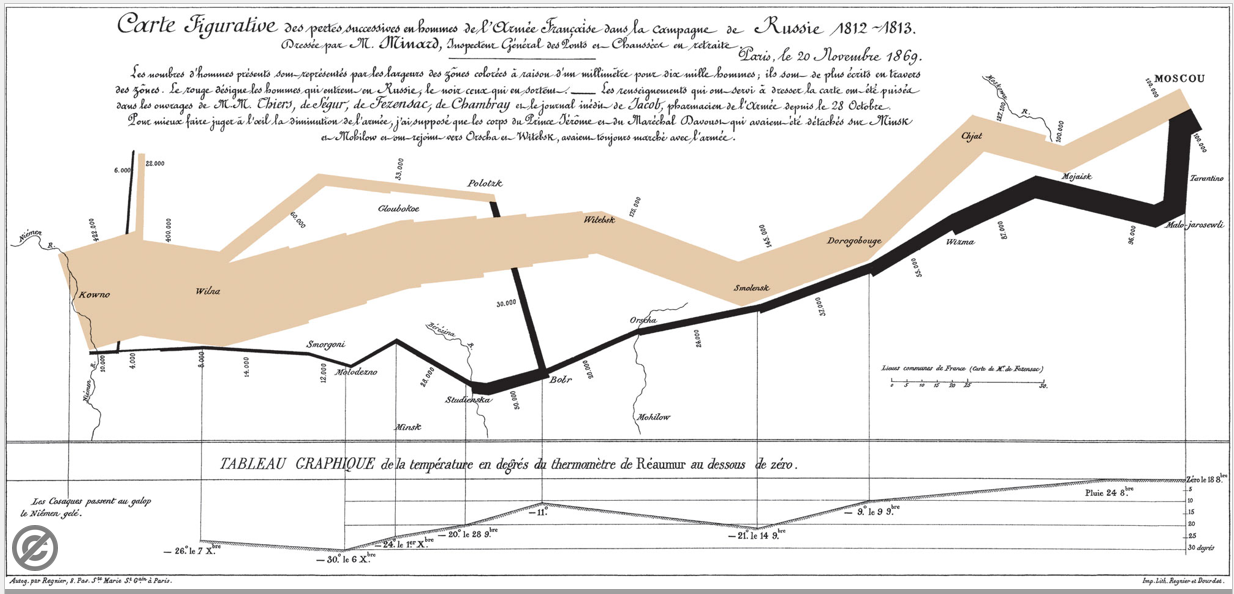
The above graphic illustrates multiple aspects of the 1812 campaign, it has been described by Edward Tufte, the statistician and champion of data visualization, as follows:
“It may well be the best statistical graphic ever drawn.”
The map was developed by Charles Joseph Minard during his retirement, in 1869, 57 years after the events depicted.
There are 6 different parameters represented in the graphic.
- The distance from the starting point in Poland to Moscow.
(French Leagues. A somewhat variable unit equaling 2-3 miles or 3.2 – 4.8 Km)
- Direction of the march.
(Minard says the red band indicates the outward march, but the color is tan, with the black band indicating the retreat)
- The number of troops at each stage of the campaign’
(The width of the band indicates the number of troops at each point
1mm = 10,000)
- The temperature at various points during the disastrous retreat.
(The temperature is indicated in degrees Réaumur an old French system
Where 0o Re = 0o C; 32o F and 80o Re = 100o C; 212o F)
- The location on specific dates during the retreat.
- Latitude and Longitude.
(I am not sure that you can determine accurate latitude and longitude, but you can determine the general geographic areas of events)
The information conveyed by Minard’s masterpiece would take pages of text and/or tables and still not be so intuitively grasped.
Harry Beck and the London Underground Map
As the London Underground grew the maps became a rat’s nest of interconnecting lines. So much so that they became difficult to interpret and use.
That was until Harry Beck had a brilliant idea.
It was a concept familiar to electrical and systems engineers, a network diagram.
Instead of showing distance and direction the London underground map simply shows connections. (There are some notional distance and direction elements).
All lines are either horizontal, vertical or at 45 degrees.
However, it almost did not see the light of day.
Beck, a draughtsman, had been laid-off and worked on the design in his own time but could not interest the management in the idea.
Eventually a limited number were produced and made available to the public.
Contrary to management expectations they were not too revolutionary or difficult to understand but proved very popular.
Thus, the map we know and love today was born.
Beck would for several years work on updating the map, but never receiving credit or a real financial reward for his efforts.
Finally with a change of management he was forced out and work on his map fell to others.
Discarded and forgotten, few knew of the genius who developed a London icon.
Years after his death he is remembers by a display at Finchley station.

The Royal mail issued a series of 1st Class stamps depicting British design classics one of which was Harry Beck’s Map.
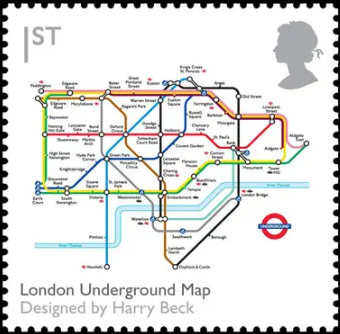
The idea is at once simple and brilliant.
So much so that whether you are travelling on the underground in Rome, Paris, Tokyo, or Hong Kong all use variations on Beck’s model.
Tony Busan and the Mind Map
Our final example is that of Mind Mapping.
Which can be a practical tool for the everyday project manager.
Mind mapping was devised by the late Tony Buzan in 1960s.
Busan told how as he entered University; he found the need to assimilate vast quantities of information from lectures and study. To accomplish this, he tried studying longer and harder, but found that the harder he worked the more the ROI decreased.
Struggling with the information overload he started to investigate how the brain learns.
This work eventually led to the development of Mind Mapping.
Whilst Tony was interested in notetaking and information assimilation his brother Barry was more interested in writing and used mind mapping to organize large quantities of data and to formulate his ideas. Using this tool, he found that when the time to write arrived he had a clear picture of where he was going.3
So! What is Mind Mapping and why should you care?
Mind Mapping Basics
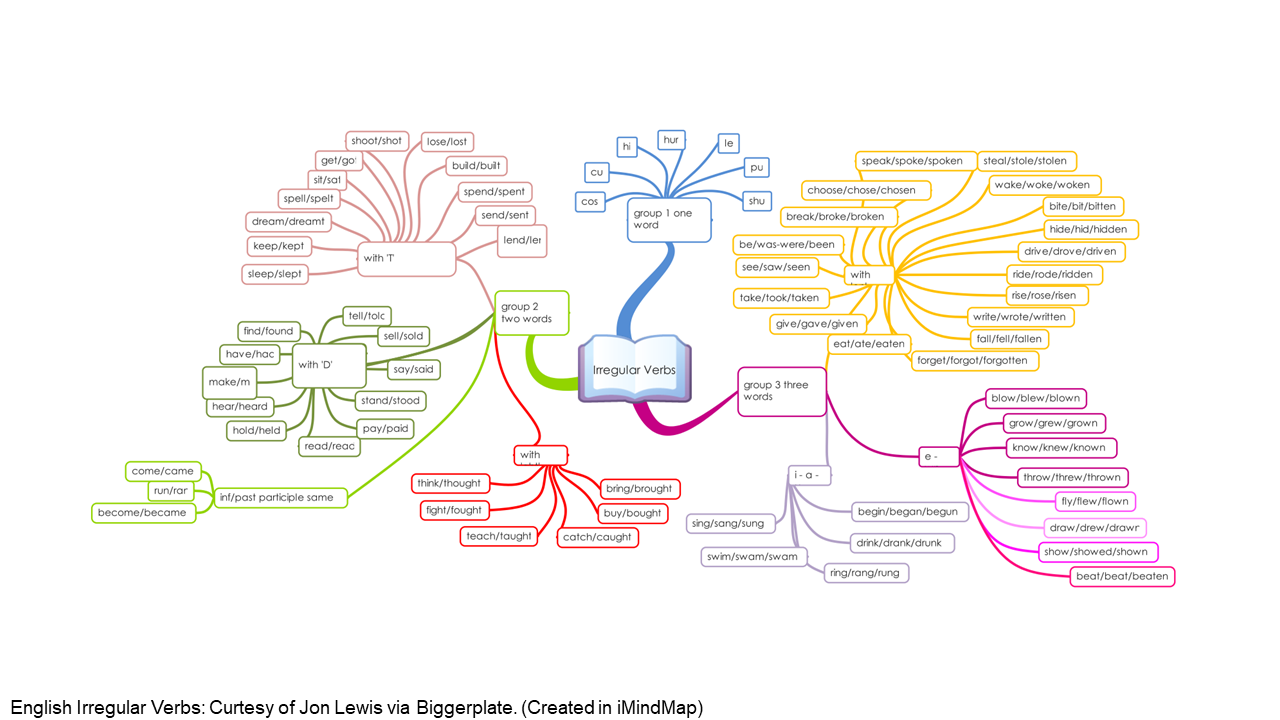
The above mind map illustrates the basic principle of mind mapping.
Normally there is a central topic, in this case irregular verbs, with various sub-topics, drilling down to more and more detail.
Although this specific case has no direct connection to project management, it is a good illustration of the principle. (I also like the style)
What do you need to get started mind mapping?
- Paper or a white board
- Pens and pencils or markers
- A little imagination and the willingness to try.
That is, it!
The Verbs mind map uses only three of the possible techniques available to the mind mapper.
- Words (The Buzan convention specifies only one word per branch)
- Colour (This indicates a relationship or highlights)
- Relationship (We remember things better if they are related in some way)
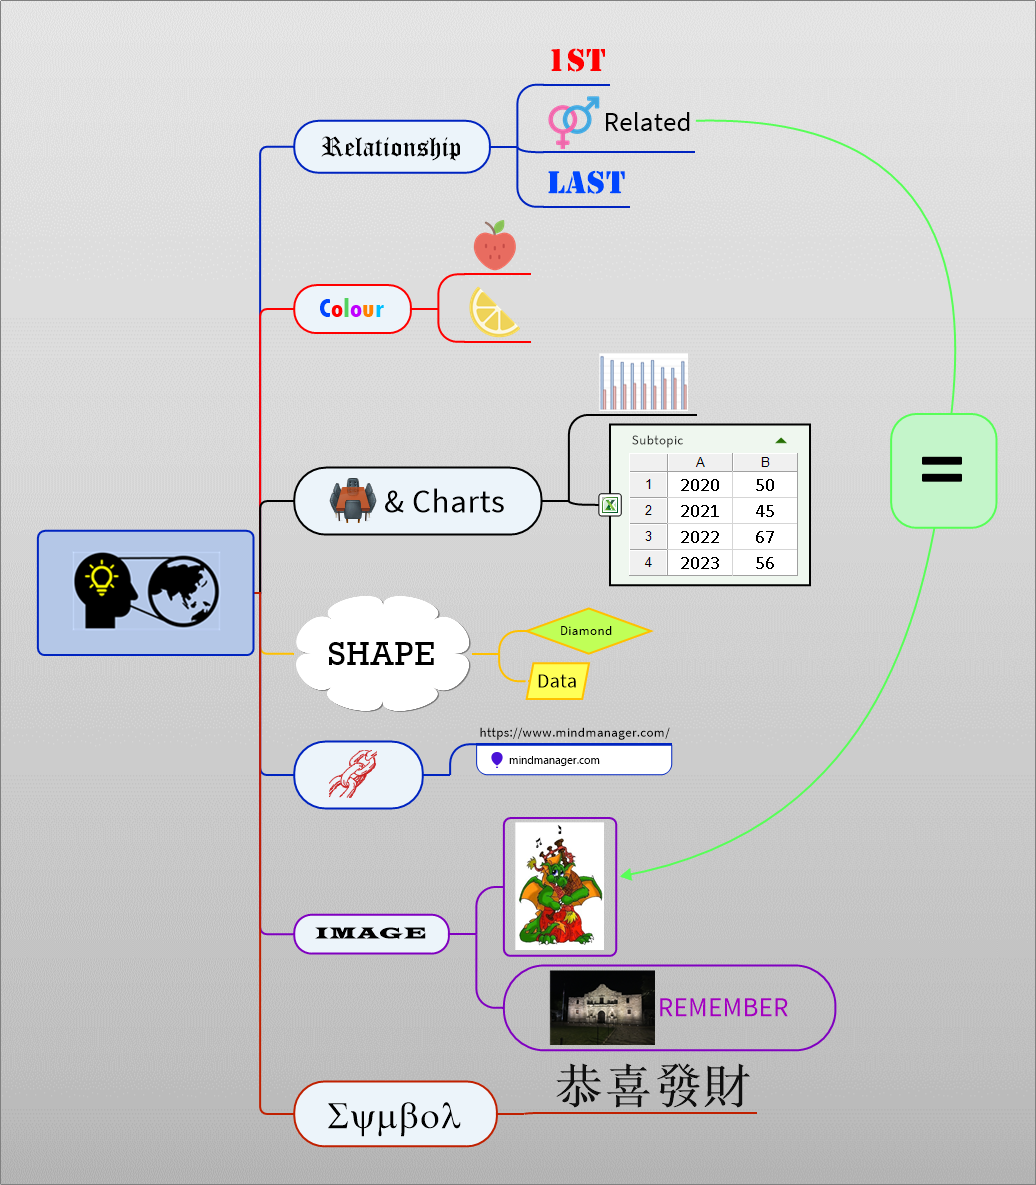
The following mind map demonstrates additional elements that are available, using mind map software. (More on that later)
- Charts and Tables (We can add charts or tables to provide more detail)
- Shapes (We can use shapes to emphasis differences or similarities)
- Links (We can add hyperlinks so that we can easily jump to a detailed source)
- Images (A picture is worth a thousand words; you can sketch on a hand drawn map)
- Symbols (Symbols can be used to draw attention or to represent a more complex idea)
Now that you have some idea on how mind mapping works, how can you put it to work?
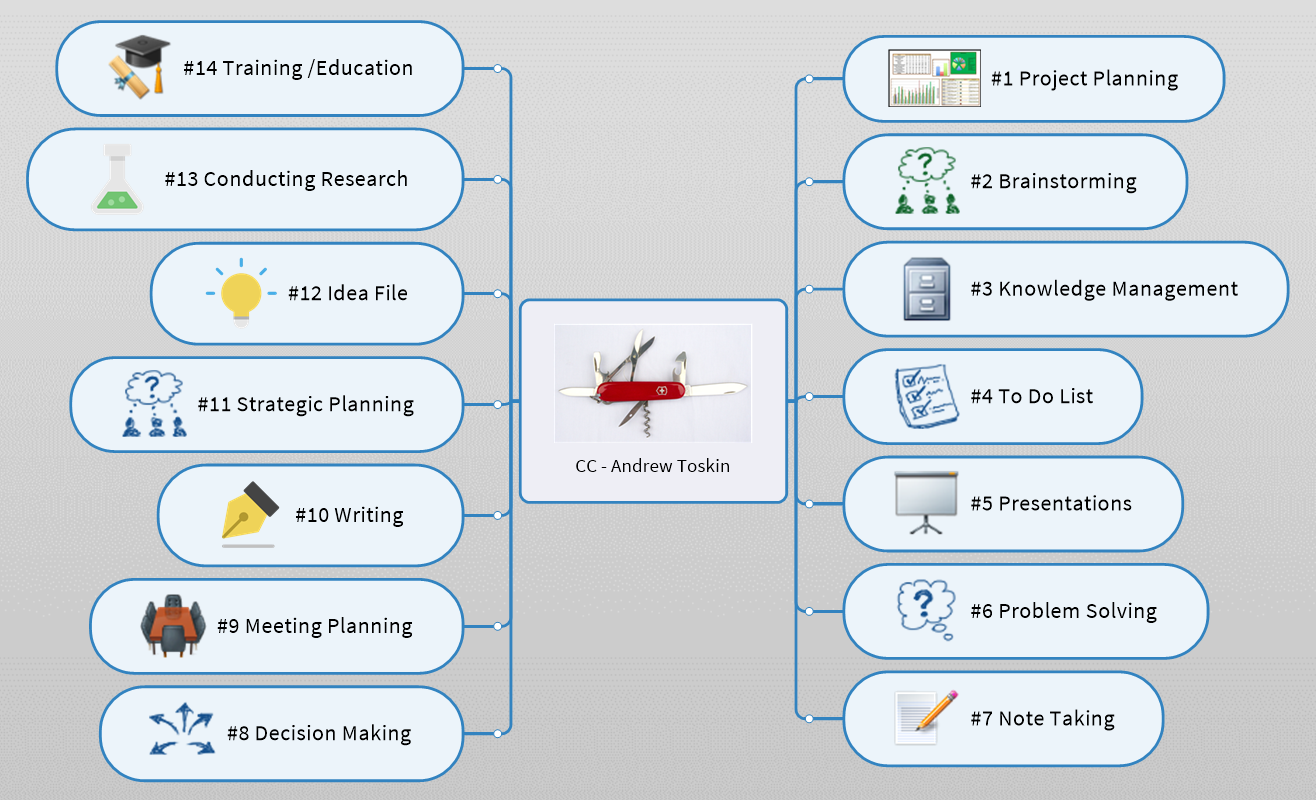
Tony Buzan called the mind map the Swiss Army Knife of the brain.
The illustration below shows several areas where mind mapping can be used to enhance understanding and performance.
However, the uses are only limited by your imagination.
Where can you find out more?
I have used MindManager since the 1990s and have remained happy with it.
That said, I am not the best person to provide feedback on the array of software offerings there are available.
I would suggest checking out Chuck Frey’s Mind Mapping Blog.
Also, Biggerplate provides a large library of Mind Maps and has comments and training. (Links to the above are in the bibliography)
If you want to learn the basics, The Mind Map Book by Tony and Barry Buzan, although old now, is still an excellent primer. (Available on Amazon)
Conclusion
I hope that I have given you some food for thought regarding visual thinking.
It seems apparent from our history and development that we have an innate skill for visualizing.
From the three examples I believe we can comprehend complex topics more easily when rendered into a visual form.
That does not mean that we should use only the visual method, we still need to use oral, written, and mathematical methods where and when appropriate.
Hybrid may be the correct solution in some cases.
Lessons for Project Managers
Minard’s 1812 graphic, and the London Underground map are only useful tools if you are studying the 1812 campaign or travelling around London, but we can learn to apply the concept to other situations.
How much better would your reports be if they condensed everything into a single sheet, rather than reams of paper. (The same applies to digital reports)
Consider using Mind Mapping as an aid for managing your projects.
Mind Mapping is a flexible tool that can be used for multiple purposes, in many settings.
In the words of Tony Buzan:
“The mind map is the Swiss Army Knife of the brain”.
On a cautionary note, the Swiss army knife is a versatile tool, but it does have limitations and sometimes you must have that specialized tool.
But if used imaginatively and wisely Mind Mapping can enhance your project management.
NOTES
1 I find these figures everywhere I look on-line but have not been able to find a paper detailing them. I will continue to check and update when I have more information.
2 It is usually referred to as the Underground map but is in fact a diagram.
3The Mind Map Book (Forward)
BIBLIOGRAPHY
- The Mind Map Book – Tony and Barry Buzan
- MindManager – (https://www.mindmanager.com/)
- The Mind Mapping Software Blog – Chuck Frey (https://mindmappingsoftwareblog.com/)
- Biggerplate – Mind Map Library (https://www.biggerplate.com/mindmap-library)
- Applied Visual Thinking (https://www.appliedviz.com/)